
The MCI Network team creates and shares tools that help residents and partner agencies take actions that build upon the resilience of the community to respond to the major stressors that impact child and family wellbeing.  In order to build a robust data system, the network collects information on how the network is functioning (process), what the network is doing (intervention), and the larger context within which the network exists (population level.) We track participation, use public data to understand the neighborhood context, and collect information on the families through biannual community surveys conducted by residents and partner agencies. MCI Network also uses public-level data, such as the Census, to build a neighborhood profile that gives network actors (residents and agencies) important information about the socio-economic characteristics of the individuals and families in the area. Finally, MCI Network chose to use the Early Developmental Index (EDI) as the population-level change indicator to track and guide the focus of our interventions.
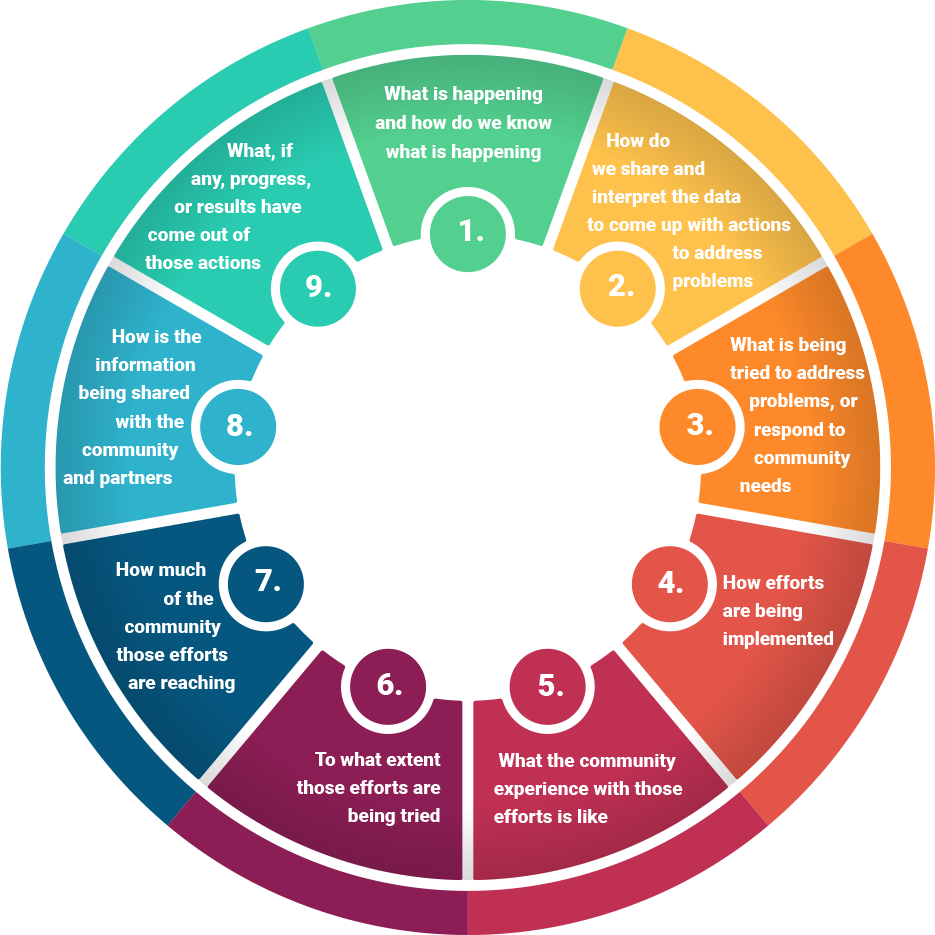
In order to make sure that our network is working, we track, collect, share and use 3 different types of data. The first type of data MCI Network collects are process measures, to help us describe the participation of community members and agencies in network meetings, the activities we use to engage, train and support our partners, and the ways that the network is functioning. We use this information to make decisions when we plan activities, design outreach for community members and partners, and in what we prioritize to make sure our network is healthy and is truly having an impact.
The major stressors that impact family and child wellbeing in the MCI catchment area require changes that go beyond the individual and to the neighborhood and population level. The population-level changes are historically difficult to affect but networks identify measures that are tied to their key priorities to inform their actions. MCI Network chose the Early Development Index because it provides data on the developmental vulnerability of children.
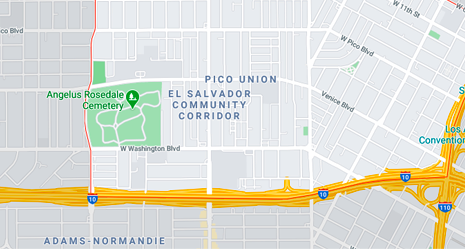
Using Census tracked data, results from the American Community Survey, and other publicly available information, MCI Network built an accessible neighborhood profile that lists the socio-economic characteristics of the people and households within the catchment area.
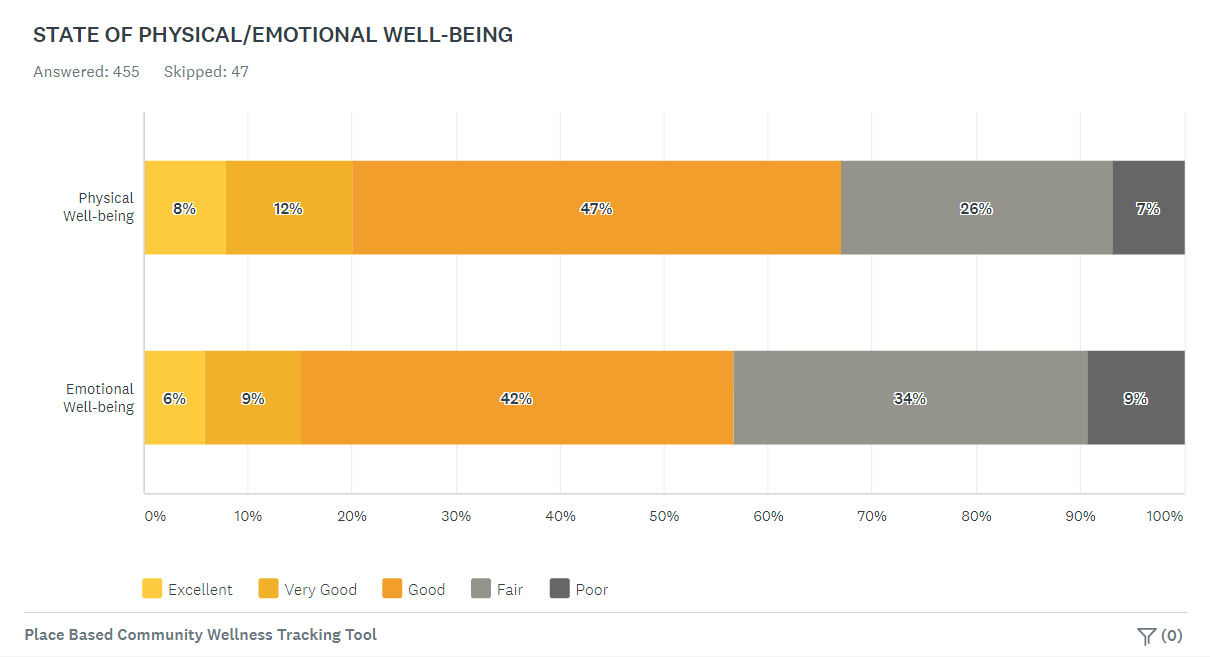
In 2013 MCI Network launched the biannual Community Survey to track movement in the catchment area towards child and family wellbeing. Using a collaborative process, the network landed on six broad areas that were shown to protect families from exhibiting signs of abuse and neglect:
The team then identified questions that would help describe the percentage of these protective factors present in the neighborhood surveyed. After launching in 2013 the Community Survey has been filled out by community volunteers and paid canvassers in 2015 and 2017 who go door to door to collect the responses of their neighbors. In 2020 the team conducted the survey in a new neighborhood next to the focus area that had been surveyed in the past. We were hoping to be able to compare the results and spark conversation about what, if any, differences might be attributed to the neighborhood profiles of the neighborhood studied from 2013-2017 and the proposed neighborhood that was to be studied in 2020. Due to the Covid-19 pandemic and public health measures, we have had to re-imagine how to continue collecting information for action and hope to announce a new data collection plan soon.

Partners and residents use this data to take actions that decrease the developmental vulnerability of children in the area. Using the EDI to guide us, we use research to plot a path that we think will help us move the dot for the children that live in the catchment area. We ask ourselves what the research shows to be contributors to children’s success in language acquisition and school. We then survey the area to find out what families, programs, schools, and partners are doing to contribute to child success in schools. Using the findings, we land upon strategies that we want to test as a network and encourage their use and spread and collect data to see if those strategies are working. Lastly, we examine the strategies that did not work and we set new agendas based on the results. We continue to look at the EDI to help us to keep our goals in sight.